Andrew Laudel (25 Aug. 2014)
Here are five DocuViz maps with some explanation about the insights they provide into the collaborative or single author composing processes for these texts.
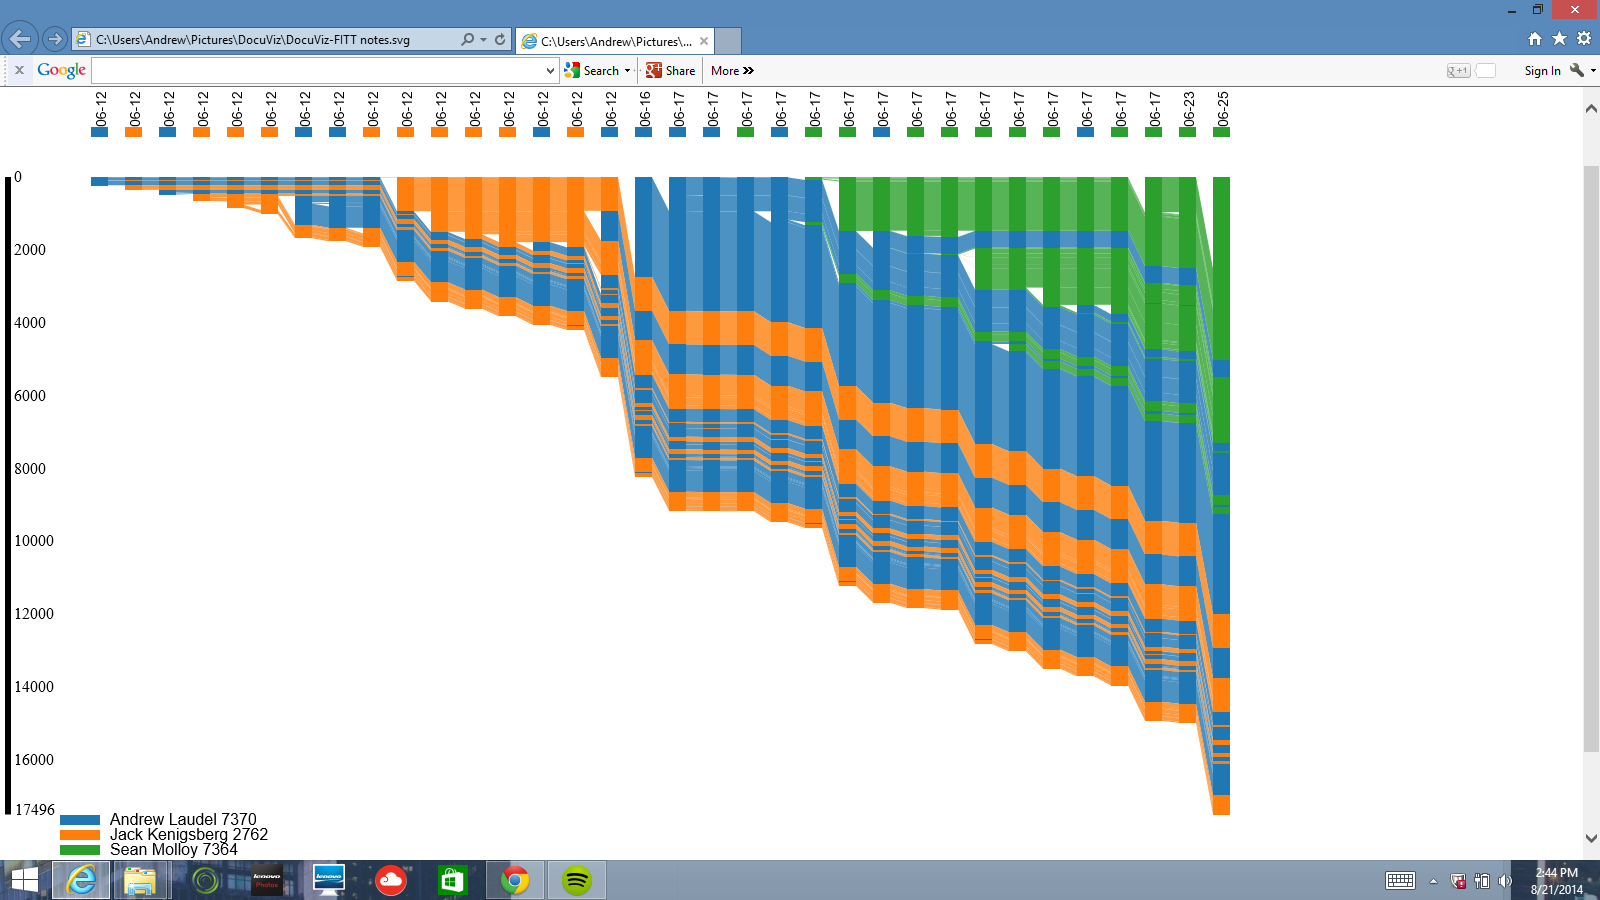
1. FITT collaborative meeting notes by Jack Kenigsberg, Sean Molloy, Andrew Laudel
The map below visualizes the history of my team’s collaborative note taking across several FITT meetings in a single google doc. You can see each team member’s contributions in their own color: Jack is orange, Sean is green, and I am blue. (Colors correspond to the order of contributors: the document’s creator is always blue, the second contributor is orange, the third is green, and so on. ) This visualization shows pretty clearly our process : in each FITT meeting, we added new text to the top of the document. The primary operation you can see is addition. However, the map does show some instances when one color is interrupted by another. These insertions, or additions by one contributor into the text of another, are particularly interesting because they show one team member’s direct response to the ideas and words of another.
Y-axis: total characters
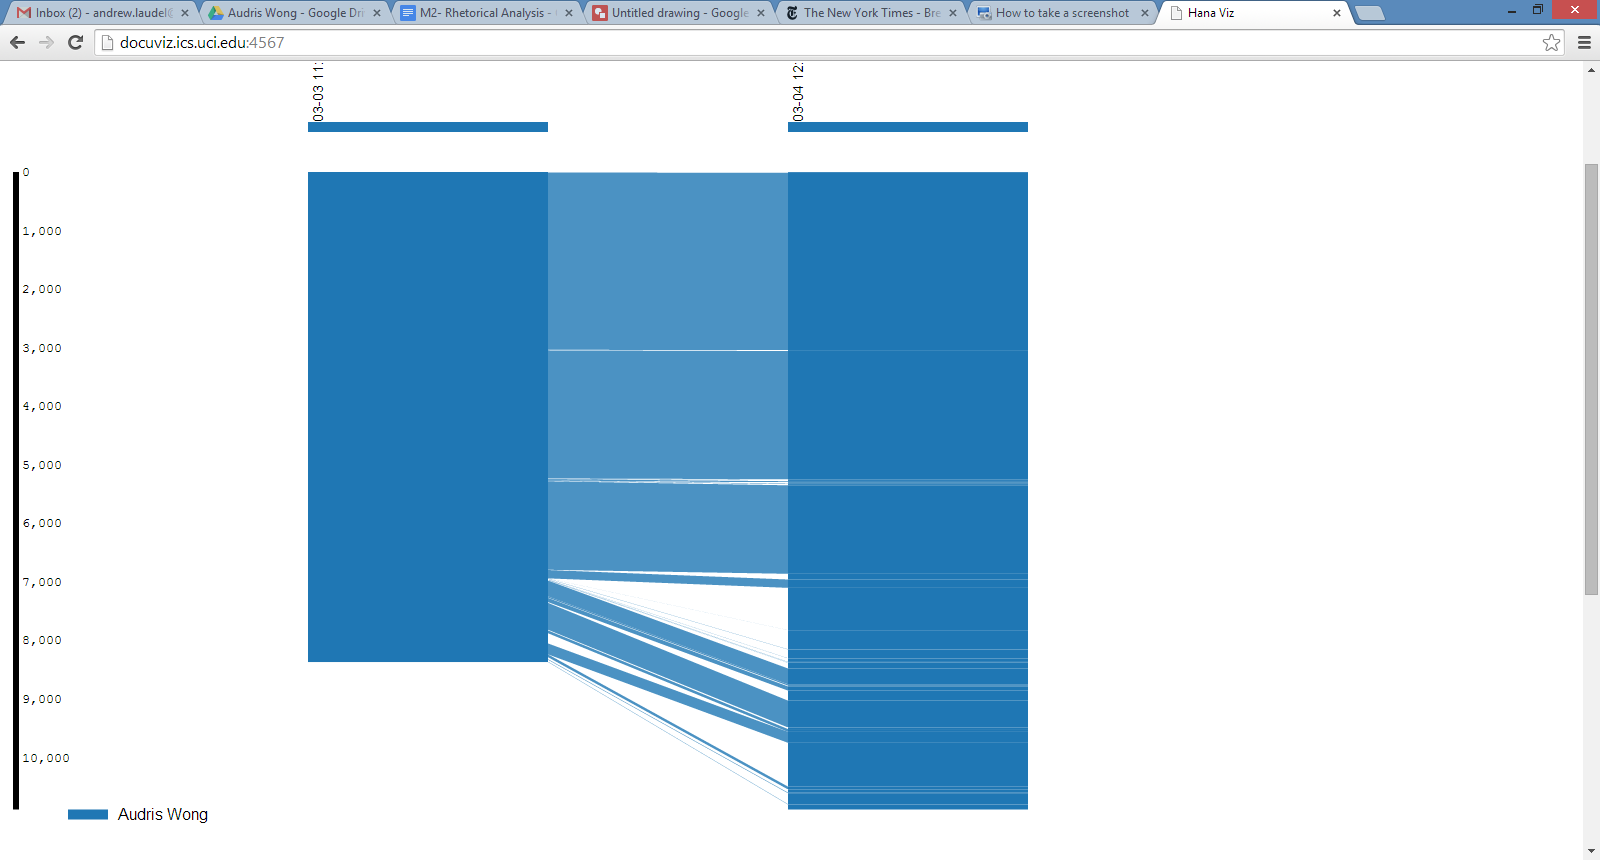
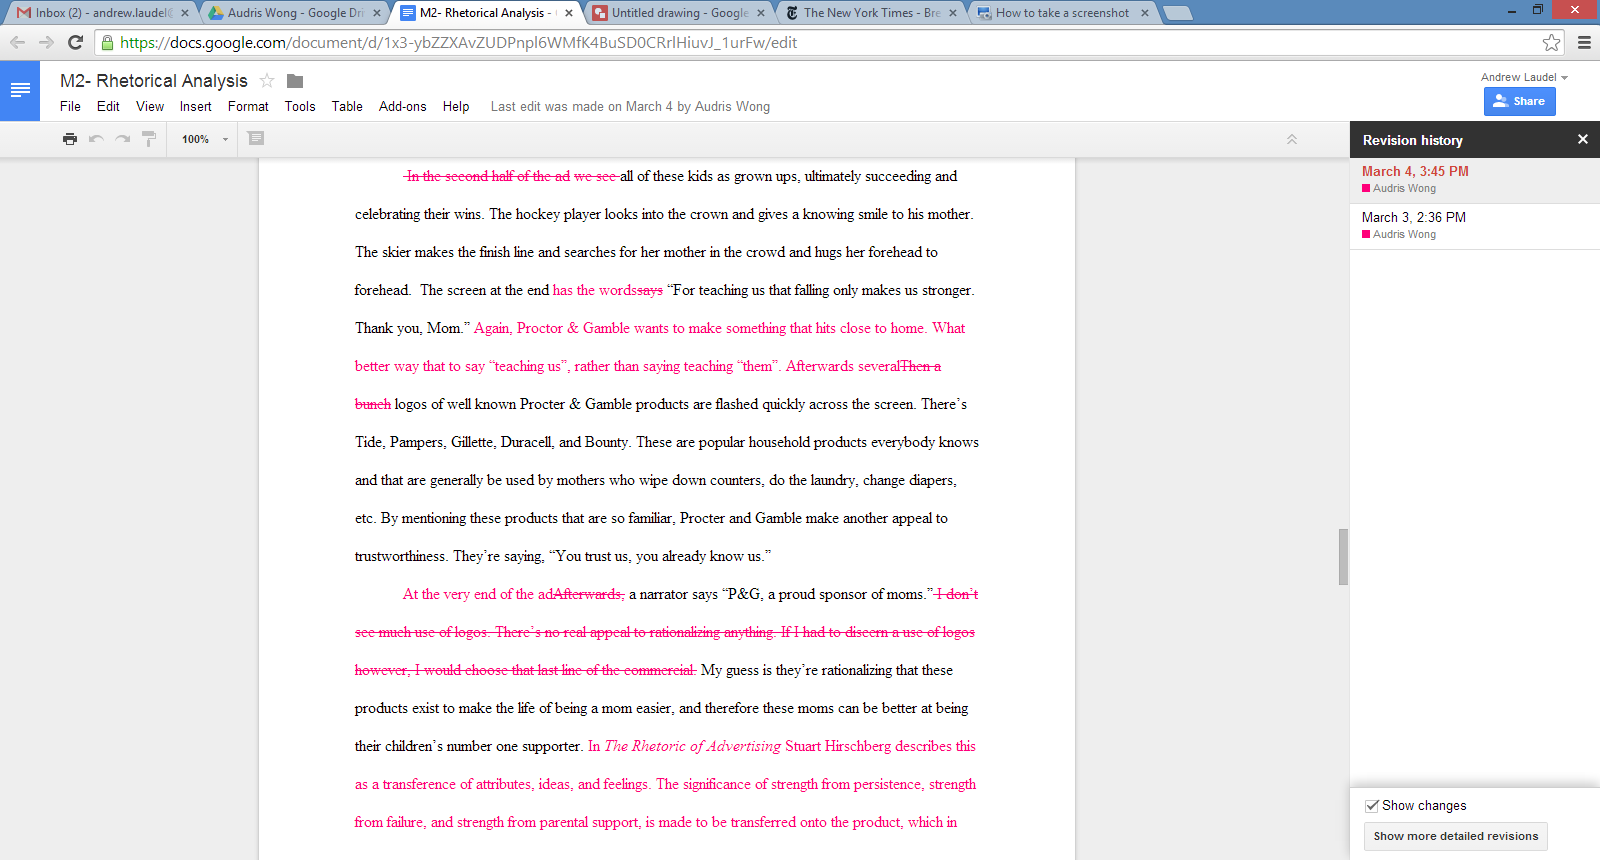
2B. Revision History function in Google Doc, timestamp 2
In 2B, we see the actual document Audris wrote. This is the view from the revision history function in Google Docs, which allows you to see the history of any document composed using the Google platform. This view confirms and clarifies the information learned from the DocuViz map: we see the actual revisions Audris made in the document using substitution (deleting and replacing text) and the addition of a new paragraph.
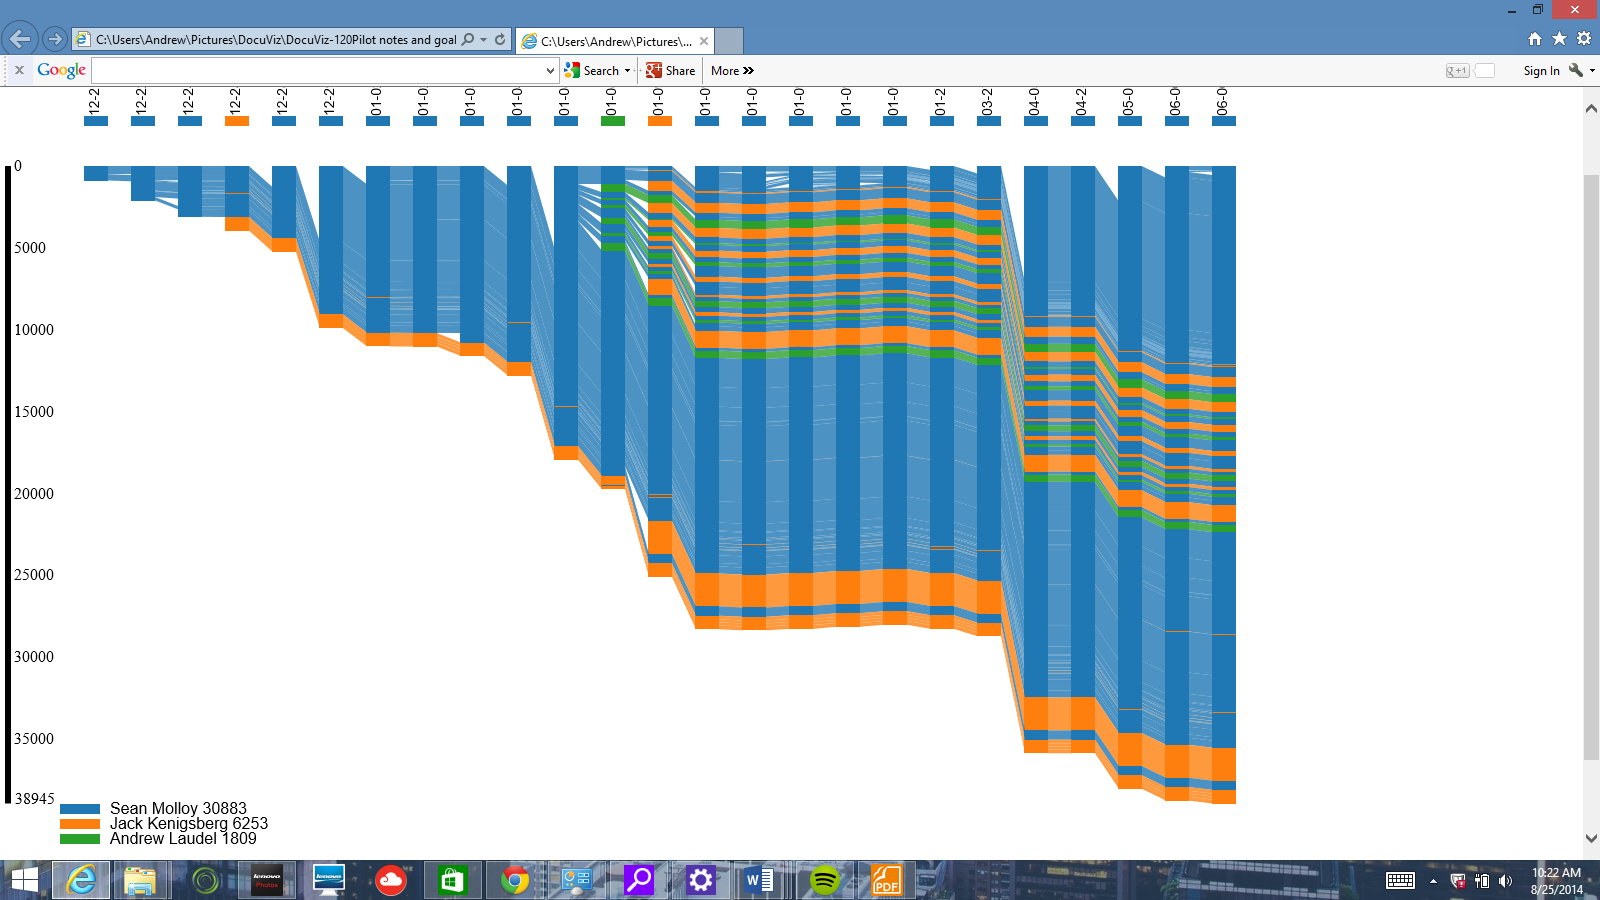
3. Collaborative Course Goals
In this image we see howSean, Jack and I collaborated to draft common teaching goals for our writing classes. Again you can see our pattern of adding new text (and ideas) to the top of the document to minimize scrolling. Sean initiated the pilot and the document itself, and his guidance is seen in the patterns of collaboration here through significant sections of blue. Especially interesting is the insertion of text by Jack and me between revisions 11 and 12 (noted by the appearance of orange and green text in the middle of blue). Looking at the visualization itself does not reveal what prompted our increased collaboration, but the map guides an analysis of the document itself. The activity between revisions 11 and 12 was prompted by our effort to work together and write course goals for our pilot – we each wrote, commented on, and rewrote versions of these goals. Since this work was on a sentence level, as opposed to word or paragraph levels, we see relatively thick strands of color variation. If revision was on a word level, we would see individual strands of color; if it was on a larger level, we would see larger chunks of color variation.
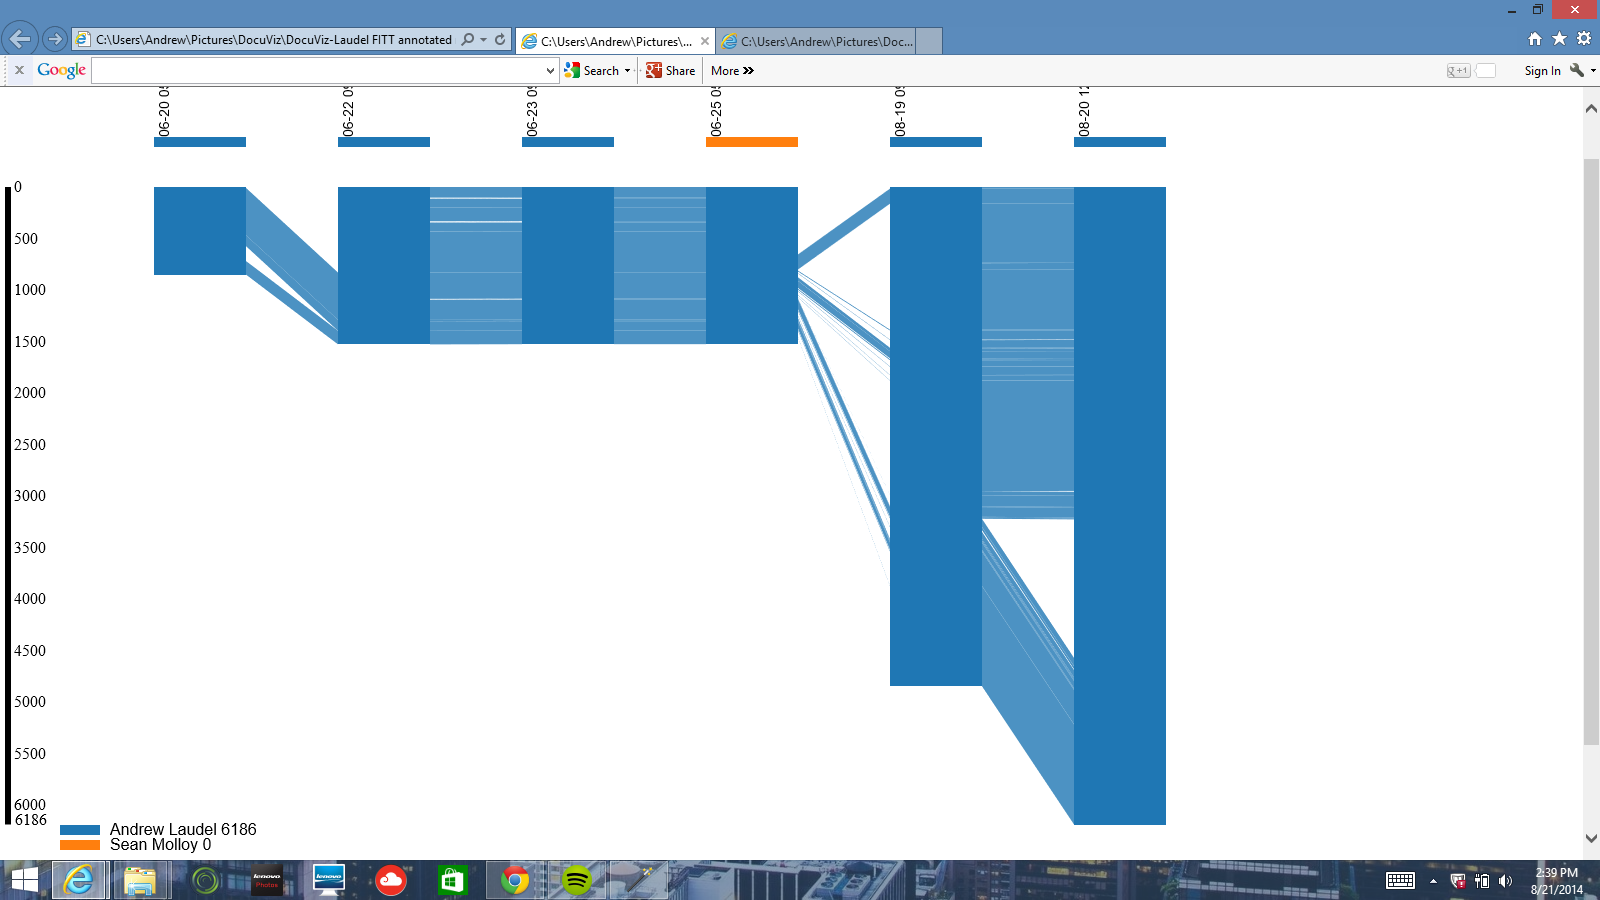
4. FITT Annotated Readings: Laudel
The Annotated Readings document I wrote for the “Discourse Community Ethnography” provides an example of a document’s growth in response to shifting ideas and the feedback of others. I initially conceived of this document as a reading list which included readings for different units. After narrowing my focus to the concept of discourse communities and developing a clearer picture of the assignment I wanted students to do, I added readings which I felt served the assignment and deleted those that became irrelevant. You can see this process visually in the insertion of text at the beginning of the document between revisions 1 and 2 as I read a wide range of readings I thought might be useful. Between revisions 4 and 5, many changes occurred. At this point I had significantly narrowed my focus and many of the readings were no longer necessary. In addition, I was encouraged to annotate the readings I had chosen. The blue strands that connect revisions 4 and 5 represent the citation for the readings that I retained, and the addition of large chunks of blue text (paragraphs) show the inserted annotations.